
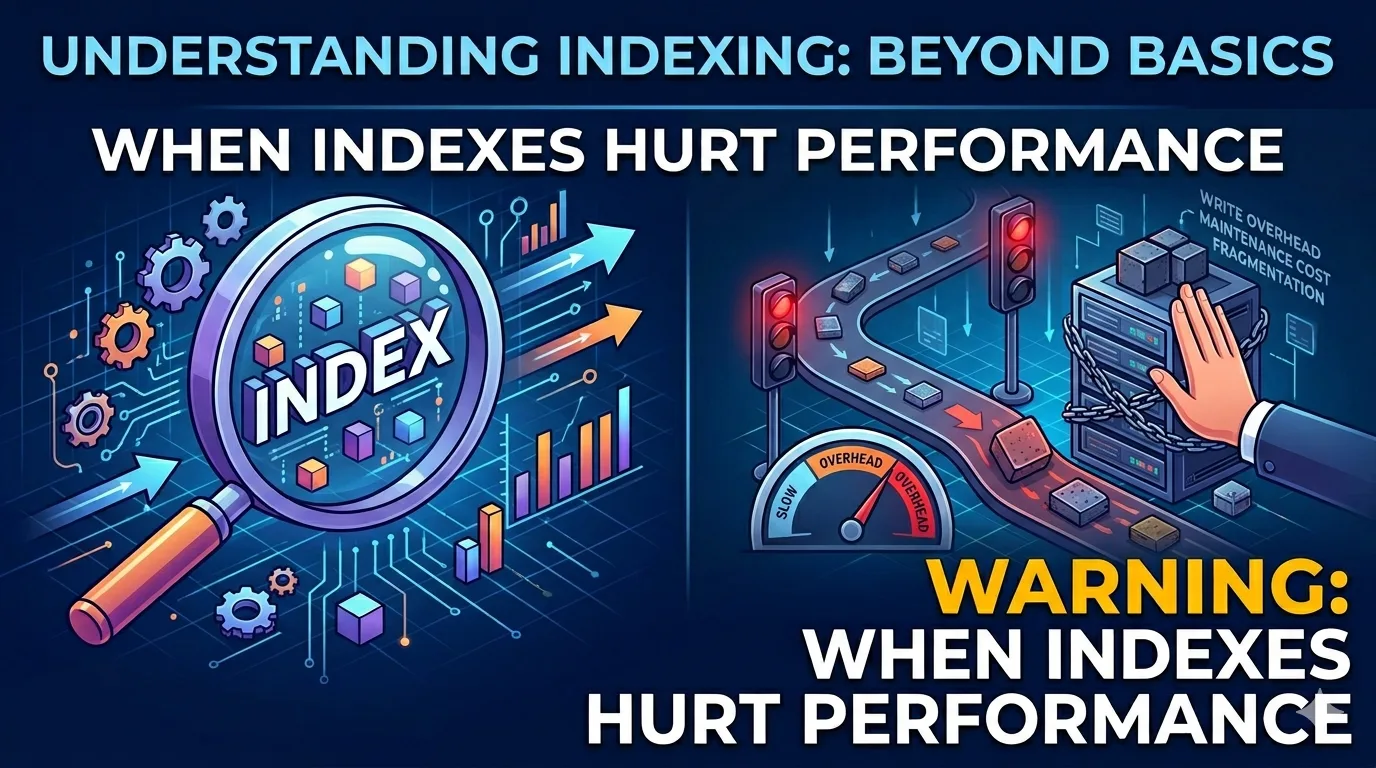
Understanding Indexing Beyond Basics: When Indexes Hurt Performance
Indexes are supposed to make your database faster — but blindly adding them can silently destroy write performance, bloat storage, and mislead the query planner. This deep-dive explores the hidden costs of over-indexing and the engineering discipline to get it right.
Introduction
Every developer learns the same lesson early: add an index, speed up your queries. It feels like one of those safe database rules — a reflex you reach for whenever a query is slow or a table grows past a few million rows. And for a long time, it works. Then one day it doesn't, and you spend hours wondering why your write throughput has degraded, your storage has ballooned, and your database server is working twice as hard as it should be.
Indexes are a trade-off. They exchange write speed and disk space for faster reads. That trade-off is excellent when the read patterns are well understood and the write volume is manageable. But the moment you start adding indexes speculatively — without profiling, without understanding your data distribution, without considering your write amplification factor — indexes stop being an asset and become a quiet, compounding liability.
The worst part is that this cost is largely invisible. You won't see a failing query. You won't get an error log entry. You'll just notice over time that inserts are a little slower, that your autovacuum is running constantly, that your pg_indexes view has grown to dozens of entries per table, and that half of them haven't been used in months.
This post is a practical deep-dive into exactly how indexes work at the storage level, why the common mental model of "indexes are always good for reads" breaks down in real production scenarios, and how to reason about indexing as an engineering decision with real trade-offs rather than a default reflex.
Background
How B-Tree Indexes Actually Work at the Storage Level
Most database indexes in PostgreSQL, MySQL, and SQL Server are implemented as B-trees (Balanced Trees). Understanding what this means physically on disk is essential to understanding where indexes help and where they hurt.
A B-tree is a self-balancing sorted tree where every node can hold multiple keys. In PostgreSQL's implementation, a B-tree index on users.email is a completely separate file on disk from the users table heap. That index file is organized as a tree of pages — each page is 8KB by default — where leaf pages store the actual indexed values in sorted order along with a ctid (block number and tuple offset) pointing to where the actual row lives in the heap file, internal pages store separator keys and child pointers used to navigate down the tree, and the root page sits at the top of the entire structure.
When PostgreSQL executes SELECT * FROM users WHERE email = 'alice@example.com', the index scan works like this:
CREATE INDEX idx_users_email ON users(email);

-- Conceptual representation of leaf nodes in the B-tree file:
-- Page 47 (leaf): ("alice@example.com",  ctid=(3,12))
--                 ("bob@example.com",    ctid=(1,4))
--                 ("carol@example.com",  ctid=(7,2))
-- Page 48 (leaf): ("dave@example.com",   ctid=(9,1))
--                 ("eve@example.com",    ctid=(2,8))
PostgreSQL reads the root page of the index file and navigates down internal pages in O(log n) time to find the leaf page containing alice@example.com. It reads the ctid — say (3, 12) — meaning block 3 of the heap file, tuple offset 12. Then it fetches that specific 8KB heap page from disk and reads the row at offset 12.
That last step is the one to internalize: fetching the heap page is random I/O. The index found the row's location, but the row itself lives in the heap file at an arbitrary disk location. When a query looks up many rows this way — jumping around to fetch one heap page here, another there — this random I/O pattern is significantly slower than reading pages sequentially from start to finish.
This is why a full sequential scan sometimes beats an index scan. When a query needs to return 20% or more of a table's rows, the database might be better off reading the heap file from beginning to end (sequential I/O, which is cache-friendly and highly optimized by the OS read-ahead buffer) rather than bouncing around the disk fetching each row by its random heap location.
The write cost is the part developers forget. Every INSERT must write the new row to the heap, then insert a new key-and-pointer entry into every B-tree index that exists on the table. Every DELETE must mark the heap tuple as dead and mark the corresponding index entries as dead too. Every UPDATE — because of PostgreSQL's MVCC model, which we'll examine in detail shortly — writes a completely new heap tuple and new entries in every index. A table with 8 indexes means every single-row change touches 9 separate data structures on disk.
The Four Scan Types the Planner Chooses Between
PostgreSQL's query planner doesn't always use an index even when one exists. It estimates the cost of multiple execution plans and chooses the cheapest one. The four main scan strategies are:
Scan TypeWhen the Planner Chooses ItI/O BehaviorSequential ScanFetching a large percentage of rows, small table, stale statisticsReads heap pages in order — fast, cache-friendlyIndex ScanHighly selective query returning very few rowsRandom heap page fetches — slow for large result setsIndex-Only ScanAll needed columns are stored in the index itselfReads index pages only, checks visibility map — very fastBitmap Heap ScanMedium selectivity, needs to balance random I/OBuilds a bitmap of heap pages first, then reads them in order
The crossover point where a sequential scan becomes cheaper than an index scan is typically somewhere between 5% and 20% of total table rows, depending on whether the table is cached in memory, the fill factor of the heap, and whether the index is covering. On a table of 10 million rows, fetching 500,000 rows (5%) via random index lookups requires up to 500,000 random page fetches. Reading the entire heap sequentially requires reading roughly 55,000 8KB pages in order. The difference is dramatic.
-- Always examine the actual plan before assuming an index helps
EXPLAIN (ANALYZE, BUFFERS, FORMAT TEXT)
SELECT * FROM orders WHERE status = 'completed';

-- Look for these signals in the output:
-- "Seq Scan" vs "Index Scan" vs "Bitmap Heap Scan"
-- "Rows Removed by Filter" — how selective is the condition really
-- "Buffers: shared hit" — how much came from cache vs disk
-- "actual rows" vs "rows" estimate — are statistics accurate?
The planner's row estimates come from table statistics gathered by ANALYZE. If statistics are stale, the planner may choose a bad plan regardless of what indexes exist — and more indexes won't fix that problem. This is an important diagnostic point we'll return to.
Main Section
When Indexes Hurt Performance
1. Write-Heavy Tables: Paying Index Tax on Every Row
The most straightforward case where indexes hurt is when a table's workload is dominated by writes rather than reads. Every index you add to a write-heavy table is a permanent tax on every insert and update that table receives, paid continuously whether the index is ever read from or not.
Consider a real-world event tracking system — the kind that records user clicks, page views, API calls, or IoT sensor readings. These tables typically receive millions of inserts per hour, are rarely queried directly in their raw form, and are usually aggregated or streamed downstream to analytics pipelines.
-- A typical event tracking table
CREATE TABLE events (
  id          BIGSERIAL PRIMARY KEY,
  user_id     INT           NOT NULL,
  event_type  VARCHAR(50)   NOT NULL,
  session_id  UUID          NOT NULL,
  page_url    TEXT,
  payload     JSONB,
  created_at  TIMESTAMPTZ   DEFAULT NOW()
);

-- Indexes added "just in case" someone queries by these columns
CREATE INDEX ON events(user_id);
CREATE INDEX ON events(event_type);
CREATE INDEX ON events(session_id);
CREATE INDEX ON events(created_at);
With these 5 indexes (including the primary key) and an insert rate of 10,000 rows per second, PostgreSQL is performing 50,000 index write operations per second on this table alone. Each of those index writes means finding the correct leaf page in the B-tree, potentially splitting pages if a leaf is full, and writing dirty pages back to disk. The WAL (Write-Ahead Log) records every one of these operations, which also adds replication lag if you're streaming to standbys.
If the events table is only queried by the analytics team once a day via a batch job, those 4 non-primary-key indexes are paying a continuous, round-the-clock write cost in exchange for slightly faster daily queries that could equally well be run as sequential scans against a read replica.
The practical solution is to separate the write path from the read path. Write to a hot table with minimal indexes. Periodically — every minute, every five minutes, or after a certain row count threshold — move data into a read-optimized table that has full indexes for the actual query patterns.
-- Hot write table: minimal indexes, maximum insert throughput
CREATE TABLE events_raw (
  id         BIGSERIAL    PRIMARY KEY,
  user_id    INT          NOT NULL,
  event_type VARCHAR(50)  NOT NULL,
  session_id UUID         NOT NULL,
  payload    JSONB,
  created_at TIMESTAMPTZ  DEFAULT NOW()
);
-- Only the primary key index exists here. Nothing else.

-- Read-optimized table: fully indexed for analytics queries
CREATE TABLE events_archive (LIKE events_raw INCLUDING ALL);
CREATE INDEX ON events_archive(user_id);
CREATE INDEX ON events_archive(event_type);
CREATE INDEX ON events_archive(created_at DESC);
CREATE INDEX ON events_archive(session_id);

-- pg_cron job to move data every 5 minutes
SELECT cron.schedule('move-events', '*/5 * * * *', $$
  WITH moved AS (
    DELETE FROM events_raw
    WHERE created_at < NOW() - INTERVAL '5 minutes'
    RETURNING *
  )
  INSERT INTO events_archive SELECT * FROM moved;
$$);
This pattern means your application's writes hit a lean table with one index, while your analytics queries run against a fully indexed archive. The write throughput on events_raw will be substantially higher, and autovacuum won't be fighting to keep up with dead tuple accumulation from index maintenance.
2. Low-Cardinality Columns: When the Index Is Statistically Useless
Cardinality is the number of distinct values in a column. High cardinality means many distinct values (like email or uuid). Low cardinality means few distinct values relative to total row count.
Creating a standard B-tree index on a low-cardinality column is one of the most common indexing mistakes, and it is particularly insidious because the index gets created without error, shows up in \d tablename, and looks legitimate — it just doesn't help while still costing writes.
Think about a users table with 10 million rows and an is_active column where 85% of users are active. Querying WHERE is_active = true would need to return 8.5 million rows. The index on is_active has exactly two leaf values: true and false. The true leaf contains 8.5 million ctid pointers to heap rows. Following 8.5 million random heap pointers is orders of magnitude slower than reading the heap sequentially.
PostgreSQL's planner knows this. It calculates the estimated cost of using the index versus doing a sequential scan and chooses the sequential scan. But you are still writing to that index on every insert and update.
-- This index will almost never be used for the common case
CREATE INDEX ON users(is_active);

EXPLAIN ANALYZE
SELECT id, email, created_at
FROM users
WHERE is_active = true;

-- PostgreSQL output:
-- Seq Scan on users  (cost=0.00..312450.00 rows=8500000 width=52)
--                    (actual time=0.042..1823.445 rows=8500000 loops=1)
--   Filter: is_active
--   Rows Removed by Filter: 1500000
-- Planning Time: 0.185 ms
-- Execution Time: 2147.321 ms

-- The index was completely ignored. You're paying write cost for nothing.
The real question is what your application actually queries. If your application only ever queries inactive users — perhaps a background job that processes accounts flagged for review — then you don't need a full-column index on is_active. You need a partial index that only indexes the rows matching the rare, selective condition.
-- Drop the useless full-column index
DROP INDEX IF EXISTS users_is_active_idx;

-- Create a partial index covering only inactive users (~15% of rows)
-- This index is highly selective and tiny compared to the full table
CREATE INDEX idx_users_inactive
ON users(id, email, created_at)
WHERE is_active = false;

-- This query now uses the partial index efficiently
EXPLAIN ANALYZE
SELECT id, email, created_at
FROM users
WHERE is_active = false;
-- Index Scan using idx_users_inactive on users
-- (actual rows=1500000, fetched via index pointer traversal)

-- Bonus: this partial index is NOT updated when you INSERT an active user
-- 85% of inserts do not touch this index at all
The partial index is updated only when a row matching its WHERE clause is inserted or modified. For a table with 85% active users, the partial index on is_active = false has 85% less maintenance overhead than a full-column index. This is a direct, measurable win on write throughput.
The same logic applies to status columns with skewed distributions. If 95% of your orders have status = 'completed' and your application mostly queries for status = 'pending' or status = 'failed', create partial indexes on those minority values rather than a full index on the status column.
-- Instead of this (full index on a low-cardinality column):
CREATE INDEX ON orders(status);

-- Do this (targeted partial indexes on actionable minority states):
CREATE INDEX idx_orders_pending
ON orders(created_at, user_id)
WHERE status = 'pending';

CREATE INDEX idx_orders_failed
ON orders(created_at, user_id)
WHERE status = 'failed';

-- These two indexes together cover a fraction of the rows,
-- cost far less to maintain, and are highly selective for the
-- queries that actually need fast responses.
3. Unused Indexes: The Permanent Silent Tax
Indexes accumulate on production databases like technical debt. One gets added during a debugging session and never removed. Another gets created for a feature that was later deprecated. A third was added speculatively because "we might query that column someday." Over months and years, a busy table ends up with 12 indexes, half of which haven't been scanned in the past six months.
Every one of those unused indexes adds a write operation to every INSERT, UPDATE, and DELETE on that table, consumes disk space (sometimes gigabytes per unused index on large tables), increases the time autovacuum takes to process dead tuples, and adds to the planner's cost estimation work on every query.
PostgreSQL exposes index usage statistics through pg_stat_user_indexes. The idx_scan counter tracks how many times each index has been used to satisfy a query since the last statistics reset.
-- Find indexes that have never been scanned
SELECT
  s.schemaname,
  s.tablename,
  s.indexname,
  s.idx_scan                                        AS total_scans,
  pg_size_pretty(pg_relation_size(s.indexrelid))    AS index_size,
  pg_size_pretty(pg_relation_size(s.relid))         AS table_size,
  100 * pg_relation_size(s.indexrelid)
      / NULLIF(pg_relation_size(s.relid), 0)        AS index_to_table_pct
FROM pg_stat_user_indexes s
JOIN pg_index i ON i.indexrelid = s.indexrelid
WHERE s.idx_scan = 0
  AND NOT i.indisprimary
  AND NOT i.indisunique
ORDER BY pg_relation_size(s.indexrelid) DESC;
An important caveat: idx_scan resets every time the PostgreSQL server restarts and also when pg_stat_reset() is called. Do not drop an index because it shows idx_scan = 0 after a recent restart or maintenance window. Track this over a rolling window of at least two to four weeks of normal production traffic. Many teams log idx_scan values daily and compare the baseline from four weeks ago to today. If the counter hasn't moved, the index is a strong candidate for removal.
Before dropping, test the removal safely. PostgreSQL lets you disable an index from the planner without dropping it:
-- Disable the index for the planner without dropping it
-- Use only in staging or during a controlled test window
UPDATE pg_index
SET indisvalid = false
WHERE indexrelid = 'public.idx_name'::regclass;

-- Run your application's full test suite and monitor query performance.
-- If nothing degrades, the index is genuinely unused.

-- Re-enable if you need to roll back
UPDATE pg_index
SET indisvalid = true
WHERE indexrelid = 'public.idx_name'::regclass;

-- Drop permanently once confirmed
DROP INDEX CONCURRENTLY public.idx_name;
Always use DROP INDEX CONCURRENTLY in production. A regular DROP INDEX takes an AccessExclusiveLock on the table, which blocks all reads and writes until the drop completes. CONCURRENTLY takes a weaker lock and allows normal operations to continue, at the cost of slightly longer execution time.
4. MVCC Write Amplification and Index Bloat
PostgreSQL uses Multi-Version Concurrency Control (MVCC) to allow readers and writers to operate concurrently without blocking each other. The implementation is elegant but has a specific cost pattern that interacts badly with large numbers of indexes.
In MVCC, rows are never modified in place. An UPDATE to a single column on a single row actually writes a completely new version of the row to the heap (the "new tuple"), marks the old row version as dead with a transaction ID (the "dead tuple"), writes new entries in every B-tree index on the table pointing to the new heap location, and marks the old index entries as dead.
This means a table with 10 indexes and a high row-churn workload — think an orders table where status is updated frequently, or a sessions table where last_seen_at is updated on every request — is executing 11 write operations (1 heap + 10 index) for every logical update, plus eventually accumulating dead tuples in both the heap and all 10 indexes.
-- Measure how bad your bloat situation is
-- Requires pgstattuple extension
CREATE EXTENSION IF NOT EXISTS pgstattuple;

SELECT
  i.indexrelid::regclass                                    AS index_name,
  pg_size_pretty(pg_relation_size(i.indexrelid))            AS current_size,
  round((pgstattuple(i.indexrelid)).dead_tuple_percent, 2)  AS dead_tuple_pct,
  round((pgstattuple(i.indexrelid)).avg_leaf_density, 2)    AS leaf_density_pct
FROM pg_index i
JOIN pg_stat_user_indexes s ON s.indexrelid = i.indexrelid
WHERE s.schemaname = 'public'
ORDER BY pg_relation_size(i.indexrelid) DESC;

-- dead_tuple_pct above 20% is a sign of significant bloat
-- leaf_density below 60% means index pages are mostly empty space
The dead tuples in the heap are reclaimed by autovacuum, which runs periodically. But autovacuum has to process dead entries in every index too, and by default it only kicks in when 20% of the table's rows are dead (autovacuum_vacuum_scale_factor = 0.2). On a 50-million-row table, that means autovacuum waits until 10 million dead tuples have accumulated before running. During that window, all 10 indexes are carrying millions of dead entries, every page traversal is slower, and every new write has to navigate around or expand bloated pages.
Tune autovacuum per-table to run more aggressively on high-churn tables rather than relying on the global defaults:
-- Tune autovacuum aggressiveness for a high-update table
ALTER TABLE orders SET (
  autovacuum_vacuum_scale_factor    = 0.01,   -- vacuum when 1% of rows are dead (default is 20%)
  autovacuum_analyze_scale_factor   = 0.005,  -- re-analyze when 0.5% of rows change
  autovacuum_vacuum_cost_delay      = 2,      -- reduce vacuum throttling in milliseconds
  autovacuum_vacuum_cost_limit      = 400     -- allow vacuum to do more work per cycle
);
For indexes that are already severely bloated, autovacuum can reclaim dead tuples but cannot compact the tree structure. For that, you need REINDEX:
-- Rebuild a bloated index without locking the table (PostgreSQL 12+)
REINDEX INDEX CONCURRENTLY idx_orders_status;

-- Or rebuild all indexes on a table
REINDEX TABLE CONCURRENTLY orders;
REINDEX CONCURRENTLY builds a new index alongside the old one and then swaps them. It avoids the full table lock that a regular REINDEX would require in production.
The practical takeaway: every index you don't strictly need is not just wasting disk space. It is making autovacuum's job harder, accumulating dead entries faster, and requiring more frequent or more aggressive maintenance to keep query performance acceptable. The fewer indexes a high-churn table has, the healthier its vacuum behavior will be.
5. Composite Index Column Ordering and the Leftmost Prefix Rule
Composite indexes — indexes on two or more columns — are one of the most powerful tools in database performance tuning. They're also one of the most commonly misused, because their usability depends entirely on the order in which columns are declared.
A composite index on (col_a, col_b, col_c) is structured as a B-tree where rows are sorted first by col_a, then by col_b within each col_a group, then by col_c within each col_b group. This means the index can be traversed efficiently only when the query's filter conditions follow the leftmost prefix of the index. You can use col_a alone, or col_a + col_b, or all three. You cannot efficiently use col_b alone or col_c alone, because the index isn't sorted by those columns at the top level — they're only sorted within subgroups defined by col_a.
-- A realistic composite index on an orders table
CREATE INDEX idx_orders_status_date_user
ON orders(status, created_at, user_id);

-- USES the index — leftmost prefix (status only)
EXPLAIN ANALYZE
SELECT * FROM orders WHERE status = 'pending';

-- USES the index — leftmost two columns (status + created_at range)
EXPLAIN ANALYZE
SELECT * FROM orders
WHERE status = 'pending'
  AND created_at > NOW() - INTERVAL '7 days';

-- USES the index — all three columns, maximum selectivity
EXPLAIN ANALYZE
SELECT * FROM orders
WHERE status = 'pending'
  AND created_at > NOW() - INTERVAL '7 days'
  AND user_id = 42;

-- Does NOT use the index efficiently — skips the leftmost column
-- PostgreSQL will do a Seq Scan or fall back to a different index
EXPLAIN ANALYZE
SELECT * FROM orders WHERE user_id = 42;

-- Does NOT use the index for sorting if leftmost column is skipped
EXPLAIN ANALYZE
SELECT * FROM orders
WHERE created_at > NOW() - INTERVAL '7 days'
ORDER BY created_at;
The column ordering decision should be driven by three priorities.
First, put equality conditions before range conditions. If your query is WHERE status = 'pending' AND created_at > '2024-01-01', the index should be (status, created_at), not (created_at, status). A range condition on created_at in the first position means the database can only narrow down by date range and must then scan all statuses within that range. An equality condition on status in the first position narrows the index to a single status group, and a range scan on created_at within that group is fast.
Second, put the most selective column first among equality conditions. If you have two equality conditions where one matches 0.1% of rows and the other matches 50%, put the high-selectivity column first. The tree traversal narrows down faster.
Third, consider whether the index can eliminate a sort. If your query includes ORDER BY created_at DESC and your index includes created_at as its last column, PostgreSQL can often read the index in reverse order and return results already sorted, eliminating a separate sort step entirely.
-- Index designed specifically for this query pattern:
-- SELECT * FROM orders WHERE status = ? ORDER BY created_at DESC LIMIT 20

-- Wrong order: range column first
CREATE INDEX ON orders(created_at, status);

-- Right order: equality column first, then sort column
CREATE INDEX ON orders(status, created_at DESC);

EXPLAIN ANALYZE
SELECT id, user_id, total
FROM orders
WHERE status = 'pending'
ORDER BY created_at DESC
LIMIT 20;
-- With the correct index: Index Scan Backward, no Sort node, near-instant
-- With the wrong index: full scan + Sort step required
A very common mistake is creating a composite index for one query, watching that query improve, and assuming all related queries benefit equally. Always run EXPLAIN ANALYZE for every distinct query pattern that touches the table. Composite index optimization is query-specific, not table-specific.
6. Function Calls and Implicit Type Coercion Silently Breaking Indexes
One of the most frustrating causes of index non-use in production is a small, invisible transformation happening in the WHERE clause that prevents the index from being applicable. The B-tree index stores raw column values as they appear in the heap. If your query transforms the column — wraps it in a function, casts it to a different type, or uses an operator that requires an implicit conversion — the index cannot be used for that lookup.
-- A standard index on email
CREATE INDEX idx_users_email ON users(email);

-- USES the index — exact value match against raw column
SELECT * FROM users WHERE email = 'alice@example.com';

-- Does NOT use the index — LOWER() transforms the column before comparison
SELECT * FROM users WHERE LOWER(email) = 'alice@example.com';

-- Does NOT use the index — DATE() strips time component from the column
SELECT * FROM users WHERE DATE(created_at) = '2024-03-15';

-- Does NOT use the index — EXTRACT() applies a function to the column
SELECT * FROM users WHERE EXTRACT(YEAR FROM created_at) = 2024;

-- May not use the index — implicit type cast if column type doesn't match
-- e.g., user_id is INT but the application sends a VARCHAR parameter
SELECT * FROM users WHERE user_id = '42';
For function calls on a column, create an expression index that stores the output of the function rather than the raw column value. The query must use the exact same expression to match.
-- Expression index: the index stores LOWER(email), not email
CREATE INDEX idx_users_email_lower ON users(LOWER(email));

-- This now uses the index
SELECT * FROM users WHERE LOWER(email) = 'alice@example.com';

-- This still does NOT use it — ILIKE is a different operator
SELECT * FROM users WHERE email ILIKE 'alice@example.com';
For date and time range queries, the cleanest solution is to rewrite the predicate to avoid transforming the column at all. Instead of extracting a date component, express the filter as a range against the raw timestamp column, which your existing timestamp index can handle efficiently.
-- Instead of applying a function to the column:
SELECT * FROM orders WHERE DATE(created_at) = '2024-03-15';

-- Rewrite as a range against the raw column:
SELECT * FROM orders
WHERE created_at >= '2024-03-15 00:00:00'
  AND created_at <  '2024-03-16 00:00:00';

-- Or using interval arithmetic:
WHERE created_at >= '2024-03-15'::date
  AND created_at <  '2024-03-15'::date + INTERVAL '1 day';
For case-insensitive text matching at scale, the citext extension is often cleaner than maintaining an expression index:
CREATE EXTENSION IF NOT EXISTS citext;

ALTER TABLE users ALTER COLUMN email TYPE citext;
CREATE INDEX ON users(email);
-- citext handles case-insensitivity at the type level

-- Both of these now use the index:
SELECT * FROM users WHERE email = 'Alice@Example.com';
SELECT * FROM users WHERE email = 'alice@example.com';
Implicit type coercion is the subtler problem. If an index is on an INTEGER column and your application sends the parameter as a VARCHAR (common in ORMs that don't strictly type-bind parameters), PostgreSQL has to cast the column before comparing, which prevents index use. Always verify that your ORM or query builder is binding parameters with the correct type. A simple EXPLAIN ANALYZE with the actual query from your application layer will reveal this — look for a Filter node with an explicit cast appearing where you expect an index lookup.
7. Reading EXPLAIN ANALYZE Before Reaching for CREATE INDEX
The final, and perhaps most important, discipline is diagnosis before action. The instinct to add an index when a query is slow is so strong that many engineers skip the step of actually understanding why the query is slow. Adding an index to the wrong problem is worse than not adding one at all — it masks the real issue while adding permanent write overhead.
Before creating any index, run a full diagnostic query plan. The BUFFERS option is critical because it shows how many shared memory buffers were hit versus read from disk, which tells you whether the bottleneck is I/O (where an index might help) or CPU and memory (where an index won't help at all).
-- Full diagnostic command
EXPLAIN (ANALYZE, BUFFERS, VERBOSE, FORMAT TEXT)
SELECT
  o.id,
  o.user_id,
  o.total,
  u.email
FROM orders o
JOIN users u ON u.id = o.user_id
WHERE o.status = 'pending'
  AND o.created_at > NOW() - INTERVAL '30 days'
ORDER BY o.created_at DESC
LIMIT 50;
Look at "rows" vs "actual rows" on every node. The planner's row estimate comes from table statistics. If the estimate is 500 and the actual is 50,000, the planner made a 100x mistake in its cost model, likely chose the wrong join strategy or scan type, and the fix is running ANALYZE orders to refresh statistics — not adding an index.
-- Refresh statistics on a specific table
ANALYZE VERBOSE orders;

-- Check when statistics were last collected
SELECT
  tablename,
  last_analyze,
  last_autoanalyze,
  n_live_tup,
  n_dead_tup
FROM pg_stat_user_tables
WHERE tablename = 'orders';
Look at "Buffers: shared hit" vs "shared read". shared hit means the data was already in PostgreSQL's shared buffer cache (RAM). shared read means it had to go to disk. If a slow query shows Buffers: shared hit=980000 read=200, the entire dataset is in memory and the bottleneck is CPU — perhaps a bad join algorithm, excessive row processing, or a sort on a large result set. An index won't help here at all.
Look for "Sort" nodes in the plan. An expensive Sort node appearing after a table scan often means the query's ORDER BY could be served by an index, eliminating the sort entirely. Sorts on large result sets are very expensive and one of the highest-value cases for index optimization.
Look for unindexed foreign key columns. PostgreSQL does not automatically create indexes on foreign key columns, unlike MySQL's InnoDB which does. Every join from orders to users on orders.user_id without an index on orders.user_id results in a sequential scan of the orders table for each lookup. This is one of the most common performance issues in schemas that have grown organically over time.
-- Find foreign key columns that are missing indexes
SELECT
  c.conname                             AS constraint_name,
  c.conrelid::regclass                  AS referencing_table,
  a.attname                             AS referencing_column,
  c.confrelid::regclass                 AS referenced_table,
  EXISTS (
    SELECT 1 FROM pg_index i
    JOIN pg_attribute ia
      ON ia.attrelid = i.indrelid
      AND ia.attnum = ANY(i.indkey)
    WHERE i.indrelid = c.conrelid
      AND ia.attname = a.attname
  )                                     AS has_index
FROM pg_constraint c
JOIN pg_attribute a
  ON a.attrelid = c.conrelid
  AND a.attnum = ANY(c.conkey)
WHERE c.contype = 'f'
  AND NOT EXISTS (
    SELECT 1 FROM pg_index i
    JOIN pg_attribute ia
      ON ia.attrelid = i.indrelid
      AND ia.attnum = ANY(i.indkey)
    WHERE i.indrelid = c.conrelid
      AND ia.attname = a.attname
  )
ORDER BY c.conrelid::regclass::text;
Running this query on a production schema that has grown over years almost always surfaces at least a few unindexed foreign keys — and adding indexes to those specific columns is one of the few index decisions that is nearly always correct.
Key Takeaways
Every index is a write multiplier. A table with N indexes means every row-level write touches N+1 data structures. This cost is paid on every insert, update, and delete, forever, whether or not the index is ever used for a read.
Low-cardinality columns rarely benefit from standard B-tree indexes. The database planner will often ignore them because a sequential scan is cheaper. Use partial indexes on minority-value conditions instead — they are smaller, more selective, and carry lower maintenance overhead.
Unused indexes are not harmless. Audit
pg_stat_user_indexesregularly. Trackidx_scanover rolling windows of several weeks before making any removal decisions. UseDROP INDEX CONCURRENTLYto avoid table locks in production.MVCC means updates are more expensive than they look. Every update writes a new heap tuple and new entries in all indexes. High-churn tables with many indexes generate severe index bloat. Tune
autovacuumaggressively per-table and scheduleREINDEX CONCURRENTLYfor bloated indexes.Composite index column order determines which queries can use the index. Equality conditions before range conditions, most selective column first among equalities, sort columns last. Verify every distinct query pattern independently with
EXPLAIN ANALYZE.Function calls on indexed columns silently disable the index. Create expression indexes for stable function transformations, rewrite date range predicates to avoid function wrapping, and verify that your ORM is binding parameters with the correct types.
Diagnosis before creation, always. Run
EXPLAIN (ANALYZE, BUFFERS)before every index decision. A mismatch between estimated and actual rows means stale statistics. Highshared hitcounts mean a CPU bottleneck. Neither problem is solved by adding an index.
Conclusion
The reason indexes hurt performance more often than most engineers expect is that the "just add an index" mental model is incomplete. It accounts for the read benefit but ignores the write cost, the storage cost, the vacuum overhead, the planner's selectivity calculations, and the maintenance burden over time. In the early life of an application when tables are small and write volumes are low, this incomplete model mostly works. As the system scales, the gaps in the model start showing up as production incidents.
The more disciplined model is to treat every index as a hypothesis: I believe the read benefit of this index justifies its ongoing write cost, and I have profiled data to support that belief. That means running EXPLAIN ANALYZE before and after, measuring write throughput with and without the index on realistic data volumes, checking selectivity against actual row distributions, and monitoring usage in production over weeks rather than minutes.
Good indexing is ultimately about understanding your data — its volume, its access patterns, its update rate, and its distribution. An index that is perfect for a 100,000-row table might be counterproductive on a 100-million-row version of the same table with a different read-to-write ratio. These decisions have to be revisited as the system evolves.
The next time a query is slow, reach for EXPLAIN (ANALYZE, BUFFERS) first. Understand what the planner is doing and why. Refresh statistics if they're stale. Check for function wrapping. Check whether a partial index would serve better than a full one. Only after that diagnosis should CREATE INDEX enter the picture — and when it does, it should be a deliberate, measured decision with a plan to monitor and validate the outcome.
If this helped you think more carefully about how you index your production databases, share it with your team. The instinct to add indexes without profiling has quietly degraded more systems than most engineers ever trace back to its source.